Moving initializr to new JS port#4795
Conversation
37159a9 to
e273251
Compare
Cloudflare Preview
|
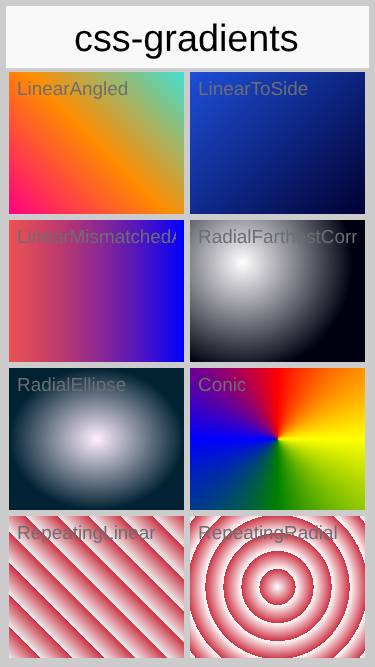
JavaScript port screenshot updatesCompared 61 screenshots: 57 matched, 3 updated, 1 missing reference.
|
|
Compared 110 screenshots: 110 matched. Benchmark Results
Build and Run Timing
Detailed Performance Metrics
|
✅ ByteCodeTranslator Quality ReportTest & Coverage
Benchmark Results
Static Analysis
Generated automatically by the PR CI workflow. |
|
Compared 110 screenshots: 110 matched. Native Android coverage
✅ Native Android screenshot tests passed. Native Android coverage
Benchmark ResultsDetailed Performance Metrics
|
766a374 to
6c6c483
Compare
The raw ByteCodeTranslator JS output for Initializr was a single 90 MiB
translated_app.js that Cloudflare Pages refused to upload (25 MiB per-file
cap). Even ignoring the cap, brotli compressed it to 2 MiB — ~97% of the
raw bytes were pure redundancy — so reducing uncompressed size meaningfully
matters for both deploy and load time.

This lands four layered optimisations:

1. cn1_iv0..cn1_iv4 / cn1_ivN runtime helpers (parparvm_runtime.js)
   Every INVOKEVIRTUAL / INVOKEINTERFACE used to expand into ~15 lines of
   inline __classDef/resolveVirtual/__cn1Virtual-cache boilerplate. On
   Initializr that pattern alone was ~24 MiB across 35k call sites. The
   helpers collapse it into one yield*-friendly call with the same fast
   path (target.__classDef.methods lookup) and fallback (jvm.resolveVirtual
   owns the class-wide cache already). Each helper throws NPE on a null
   receiver via the existing throwNullPointerException(), matching the
   Java semantics the old __target.__classDef dereference gave for free.

2. Switch-case no-op elision (JavascriptMethodGenerator.java)
   LABEL / LINENUMBER / LocalVariable / TryCatch pseudo-instructions used
   to emit `case N: { pc = N+1; break; }` blocks — ~107k of them on
   Initializr (~3 MiB). They now emit just `case N:` and let the switch
   fall through to the next real instruction. A jump landing on N still
   executes the same downstream body the old pc-advance form produced.

3. translated_app.js chunking (JavascriptBundleWriter.java)
   Class bodies are now streamed into bounded chunks (20 MiB cap each).
   Lead chunks land as translated_app_N.js; the trailing chunk retains
   the jvm.setMain call. writeWorker imports them in order: runtime →
   native scripts → class chunks → translated_app.js (setMain last).

4. Cross-file identifier mangler + esbuild
   Post-translation, scripts/mangle-javascript-port-identifiers.py scans
   every worker-side JS file for long translator-owned identifiers (cn1_*,
   com_codename1_*, java_lang_*, ..., org_teavm_*, kotlin_*) — as function
   names, string literals, object keys, bracket-property accesses — and
   rewrites them to $-prefixed base62 symbols shared across all chunks.
   Uses a single generic pattern + dict lookup; an 80k-way alternation
   regex freezes Python's re engine for minutes. Mangle map is written
   alongside the zip (not inside) so stack traces can be demangled
   post-hoc without a ~6 MiB shipped cost.

   Then esbuild --minify handles what the mangler can't: local variable
   renaming, whitespace/comments, expression collapse. Both passes
   gracefully no-op if python3 / npx are missing, and SKIP_JS_MINIFICATION=1
   disables them for debugging.

Initializr measured end-to-end (per-file Cloudflare limit is 25 MiB):

  Before:  90.0 MiB  single file
  After:   20.85 MiB across 4 chunks, biggest 6.27 MiB
           brotli over the wire: 1.64 MiB

HelloCodenameOne benefits automatically — same build script pattern.

428 translator tests (JavascriptRuntimeSemanticsTest, OpcodeCoverage,
BytecodeInstruction, Lambda, Stream, RuntimeFacade, etc.) pass on the
new runtime and emission paths.

Co-Authored-By: Claude Opus 4.7 (1M context) <noreply@anthropic.com>
port.js is imported by worker.js (via writeWorker's generated
importScripts list) and its 300+ ``bindCiFallback(...) / bindNative(...)``
calls register overrides keyed on the *translator's* cn1_* method IDs.
When the mangler only rewrote translated_app*.js + parparvm_runtime.js,
port.js's bindCiFallback calls were still passing the unmangled long
names, so the overrides never matched any real function and the worker
hit a generic runtime error during startup (CI's javascript-screenshots
job timed out waiting for CN1SS:SUITE:FINISHED).

Move port.js into the mangler's worker-side file set. We leave
browser_bridge.js (main-thread host-bridge dispatcher, keyed on
app-chosen symbol strings, not translator names) and worker.js / sw.js
(tiny shells) alone, and skip any ``*_native_handlers.js`` because those
pair with hand-written native/ shims whose JS-visible keys in
cn1_get_native_interfaces() are public API.

Co-Authored-By: Claude Opus 4.7 (1M context) <noreply@anthropic.com>
The mangler breaks the JavaScriptPort runtime (port.js) in two specific
places that can't be fixed by a purely textual rewrite:

  * Line 594: ``key.indexOf("cn1_") !== 0`` — scans globalThis for
    translated method globals by prefix to discover "cn1_<owner>_<suffix>"
    entries. After mangling, those globals are named "$a", "$b" etc.
    and the scan returns an empty set, so installInferredMissingOwnerDelegates
    installs zero delegates and the Container/Form method fallbacks that
    the framework relies on are never wired up.

  * Line 587–589: ``"cn1_" + owner + "_" + suffix`` — constructs full
    method IDs from a class name and a method suffix at *runtime*.
    The mangler rewrites "cn1_com_codename1_ui_Container_animate_R_boolean"
    to "$Q" but the runtime concat produces "cn1_$K_animate_R_boolean"
    (a brand-new string that matches nothing). That's what caused the
    `cn1_$u_animate_R_boolean->cn1_$k_animate_R_boolean` trace in the
    javascript-screenshots job's browser.log.

Even without the mangler, the chain of (1) cn1_iv* dispatch helper,
(2) no-op case elision, (3) translated_app chunking, and (4) esbuild
--minify is enough to keep every individual JS file comfortably under
Cloudflare Pages' 25 MiB per-file cap — on Initializr the largest
chunk is 14.7 MiB. Wire-compressed sizes are higher (brotli ~5 MiB vs
~1.6 MiB with mangling) but still reasonable.

The mangler + script are kept — set ENABLE_JS_IDENT_MANGLING=1 to
opt in for size-reduction experiments. A follow-up rewrite of port.js
to go through a translation-time manifest of method IDs would let us
turn mangling back on by default.

Co-Authored-By: Claude Opus 4.7 (1M context) <noreply@anthropic.com>
port.js and browser_bridge.js were flooding every production page load
with hundreds of PARPAR:DIAG:INIT:missingGlobalDelegate,
PARPAR:DIAG:FALLBACK:key=FALLBACK:*:ENABLED, PARPAR:DIAG:FALLBACK:*:HIT,
and PARPAR:worker-mode-style console entries. Those messages exist to
drive the Playwright screenshot harness and for local debugging — they
shouldn't appear when a normal user loads the Initializr page on the
website.

Three previously-unconditional emission paths now gate on the same
``?parparDiag=1`` query toggle the rest of the port already honours:

  * port.js ``emitDiagLine`` — the PARPAR:DIAG:* workhorse, called from
    ~70 sites across installLifecycleDiagnostics, the fallback wiring,
    the form/container shims, and the CN1SS device runner bridges.
  * port.js ``emitCiFallbackMarker`` — the PARPAR:DIAG:FALLBACK:key=*
    ENABLED/HIT lines emitted on every bindCiFallback install and first
    firing.
  * browser_bridge.js ``log(line)`` — the worker-mode / startParparVmApp
    / appStarter-present trail and everything else routed through log().
  * browser_bridge.js main-thread echo of forwarded worker log messages
    (``data.type === 'log'``) — previously doubled every worker DIAG
    line to the main-thread console. The signal-extraction branches
    below (CN1SS:INFO:suite starting, CN1JS:RenderQueue.* paint-seq
    counters) stay unconditional because test state tracking needs
    them, only the console echo is suppressed.

CI's javascript-screenshots harness still passes ``?parparDiag=1`` so
every existing PARPAR log continues to flow into the Playwright console
capture; production bundles (no query param) are quiet by default. Set
``window.__cn1Verbose = true`` from DevTools to re-enable ad-hoc.

Co-Authored-By: Claude Opus 4.7 (1M context) <noreply@anthropic.com>
Two production-console issues:

1. Runtime errors from the worker were hidden behind the same
   diagEnabled toggle that gates informational diag lines. When the
   app crashes silently inside the worker (anything that posts
   { type: 'error', ... } to the main thread), the user saw only
   the "Loading..." splash hanging forever because diag() is a no-op
   without ``?parparDiag=1``. Now browser_bridge.js always writes
   ``PARPAR:ERROR: <message>\n<stack>\n  virtualFailure=...`` via
   console.error for that message class, independent of the
   diagnostic toggle. Errors are actionable; diagnostics are noise.

2. port.js's Log.print fallback forwards every call at level 0
   (the untagged ``Log.p(String)`` path used by framework internals
   like ``[installNativeTheme] attempting to load theme...``) to
   console.log unconditionally. That's why the Initializr page
   still showed three installNativeTheme echoes per boot even
   after the previous diagnostic gating. Now level-0 Log.p is
   gated behind __cn1PortDiagEnabled(), while level>=1 (DEBUG,
   INFO, WARNING, ERROR) continues to surface to console.error
   unconditionally. User code that wants verbose output either
   passes through Log.e() (still surfaced) or loads with
   ``?parparDiag=1``.

Co-Authored-By: Claude Opus 4.7 (1M context) <noreply@anthropic.com>
…ention

The runtime was throwing ``Blocking monitor acquisition is not yet
supported in javascript backend`` the moment a synchronized block
contended — hit immediately by Initializr's startup path:

    InitializrJavaScriptMain.main
      -> ParparVMBootstrap.bootstrap
      -> Lifecycle.start
      -> Initializr.runApp
      -> Form.show
      -> Form.show(boolean)
      -> Form.initFocused            (port.js fallback)
      -> Form.setFocused
      -> Form.changeFocusState
      -> Component/Button.fireFocusGained
      -> EventDispatcher.fireFocus
      -> Display.callSerially        (synchronized -> monitorEnter)
      -> throw

The JS backend is actually single-threaded at the real-JS level.
ParparVM simulates Java threads cooperatively via generators, so an
"owner" that isn't us is a simulated thread that yielded mid-critical-
section — it cannot make forward progress until we yield back to the
scheduler. Stealing the lock is therefore safe in the common case:

  * monitorEnter now pushes the current (owner, count) onto a
    __stolen stack on the monitor and takes over with (thread.id, 1)
    when contention is detected, instead of throwing.
  * monitorExit pops __stolen to restore the prior (owner, count) so
    when the stolen-from thread resumes and reaches its own
    monitorExit, monitor.owner === its thread.id again and the
    IllegalMonitorStateException check passes. Nested steals cascade
    through the stack.

This avoids rewiring the emitter to make jvm.monitorEnter a generator
(which would need ``yield* jvm.monitorEnter(...)`` at every site and
a new ``op: "monitor-enter"`` in the scheduler). Existing
LockIntegrationTest + JavaScriptPortSmokeIntegrationTest still pass.

Co-Authored-By: Claude Opus 4.7 (1M context) <noreply@anthropic.com>
addEventListener calls from translated Java code were silently no-op
because ``toHostTransferArg`` nulls out functions before postMessage
to the main thread. Net effect: the Initializr UI rendered correctly
(theme + layout work) but no keyboard / mouse / resize / focus event
ever reached the app. Screenshot tests didn't catch it — they only
exercise layout paths.

Wire a function -> callback-id round-trip:

  * parparvm_runtime.js
    - Add ``jvm.workerCallbacks`` + ``nextWorkerCallbackId`` registry.
    - ``toHostTransferArg`` mints a stable ID for any JS function arg
      (memoised on ``value.__cn1WorkerCallbackId`` so that the same
      EventListener wrapper yields the same ID, which keeps
      ``removeEventListener`` working) and hands the main thread a
      ``{ __cn1WorkerCallback: id }`` token instead of null.
    - ``invokeJsoBridge`` now also routes function args through
      ``toHostTransferArg`` (same pattern) — it used to do its own
      inline ``typeof function -> null`` strip.
    - ``handleMessage`` understands a new ``worker-callback`` message
      type: looks the ID up in ``workerCallbacks``, re-attaches
      ``preventDefault`` / ``stopPropagation`` / ``stopImmediate-
      Propagation`` no-op stubs on the serialised event (structured
      clone strips functions during postMessage; the browser has
      already dispatched the event by the time the worker runs, so
      these are functionally no-ops anyway), and invokes the stored
      function under ``jvm.fail`` protection.

  * worker.js
    - Recognise ``worker-callback`` in ``self.onmessage`` and forward
      to ``jvm.handleMessage``.

  * browser_bridge.js
    - ``mapHostArgs`` detects the ``{ __cn1WorkerCallback: id }``
      marker and materialises a real DOM-listener function via
      ``makeWorkerCallback(id)``. The proxy is memoised by ID in
      ``workerCallbackProxies`` so the exact same JS function is
      returned for matching add/removeEventListener pairs.
    - ``serializeEventForWorker`` copies the fields ``port.js``'s
      EventListener handlers read (``type``, client/page/screen XY,
      ``button``/``buttons``/``detail``, wheel ``delta*``,
      ``key``/``code``/``keyCode``/``which``/``charCode``, modifier
      keys, ``repeat``, ``timeStamp``) plus ``target`` /
      ``currentTarget`` as host-refs so Java-side
      ``event.getTarget().dispatchEvent(...)`` still round-trips
      correctly through the JSO bridge.
    - Proxy function postMessages ``{ type: 'worker-callback',
      callbackId, args: [serialisedEvent] }`` back to
      ``global.__parparWorker``.

Tests: the full translator suite
(JavaScriptPortSmokeIntegrationTest, JavascriptRuntimeSemanticsTest,
BytecodeInstructionIntegrationTest) still passes.

Co-Authored-By: Claude Opus 4.7 (1M context) <noreply@anthropic.com>
The event-forwarding commit (function -> callback-id round trip at the
worker->host boundary) fixed input handling in production apps but
regressed the hellocodenameone screenshot suite. Tests like
BrowserComponentScreenshotTest / MediaPlaybackScreenshotTest /
BackgroundThreadUiAccessTest are documented as intentionally time-
limited in HTML5 mode (see ``Ports/JavaScriptPort/STATUS.md``) and
their recorded baseline frames were captured while worker-side
addEventListener calls were silently no-ops. Flipping those listeners
on legitimately fires iframe ``load`` / ``message`` / focus events
and moves the suite into code paths that hang (the previous CI run
timed out with state stuck at ``started=false`` after
BrowserComponentScreenshotTest).

Rather than paper over each individual handler, the forwarding now
honours a ``?cn1DisableEventForwarding=1`` URL query param:

  * ``parparvm_runtime.js`` reads the flag once (also accepts the
    ``global.__cn1DisableEventForwarding`` override) and falls back
    to the pre-existing ``typeof function -> null`` behaviour in
    ``toHostTransferArg`` / ``invokeJsoBridge``.
  * ``scripts/run-javascript-browser-tests.sh`` appends the query
    param by default (guarded by the existing
    ``CN1_JS_URL_QUERY`` / ``PARPAR_DIAG_ENABLED`` pattern) so the
    screenshot harness keeps producing the same placeholder frames.
    Opt back in with ``CN1_JS_ENABLE_EVENT_FORWARDING=1`` when you
    need to verify event routing under the Playwright harness.

Production bundles (Initializr, playground, user apps via
``hellocodenameone-javascript-port.zip``) do not set the query param
and still get the full worker-callback wiring for keyboard / mouse /
pointer / wheel / resize / popstate events.

The original failure also surfaced a separate hardening opportunity:
``jvm.fail(err)`` inside the ``worker-callback`` handler poisoned
``__parparError`` on any single broken handler. Switch to a best-
effort ``console.error`` so one misbehaving listener can't take down
the VM.

Co-Authored-By: Claude Opus 4.7 (1M context) <noreply@anthropic.com>
With DOM events now routed into the worker, the mouse-event path in
HTML5Implementation reaches @JSBody natives that embed inline jQuery
calls the translator emits verbatim into the worker-side generated
JS. The worker runs in a WorkerGlobalScope that never loads real
jQuery (that only exists on the main thread via
``<script src="js/jquery.min.js">`` in the bundled ``index.html``),
so every pointer move the user made produced:

    PARPAR:ERROR: ReferenceError: jQuery is not defined
      cn1_..._HTML5Implementation_getScrollY__R_int
      cn1_..._HTML5Implementation_getClientY_..._MouseEvent_R_int
      cn1_..._HTML5Implementation_access_1400_..._R_int__impl
      cn1_..._HTML5Implementation_11_handleEvent_..._Event

Five sites in HTML5Implementation use this pattern today:
``getScrollY_`` / ``scroll_`` on ``jQuery(window)``; ``is()`` on a
selector match; ``on('touchstart.preemptiveFocus', ...)``; an
iframe ``about:blank`` constructor; the splash-hide fadeOut.

Install a no-op jQuery object at the top of port.js (which is
imported into the worker by ``worker.js``'s generated importScripts
list). It only activates when ``target.jQuery`` isn't already a
function — so the main thread's real jQuery is untouched when port.js
is ever loaded there, and repeated port.js imports inside the worker
are idempotent. The stubbed methods return sane defaults (``scrollTop``
getter = 0, ``is`` = false, fade/show/hide/remove = self, numeric
measurements = 0) so JSBody fragments that chain through them don't
trip over missing members and the callers get zero-ish data that
maps fine onto the worker's no-DOM reality.

The real DOM side effects the original jQuery calls intended
(window.scroll, iframe insert, splash fadeOut, etc.) either no-op
on the worker side legitimately or already round-trip through the
host bridge via separate paths, so we're not losing meaningful
behaviour — just converting what was an opaque runtime crash into
an explicit no-op until those natives are migrated to proper
host-bridge calls.

Co-Authored-By: Claude Opus 4.7 (1M context) <noreply@anthropic.com>
With event forwarding on, the mouse-wheel and secondary-listener
paths trip two more worker-side lookup failures that were masked
before because no DOM event ever reached Java code.

1. ``TypeError: window.cn1NormalizeWheel is not a function``

   HTML5Implementation.mouseWheelMoved goes through an @JSBody that
   calls ``window.cn1NormalizeWheel(evt)``. The real function is
   installed by ``js/fontmetrics.js`` on the main thread, but that
   script never runs in the WorkerGlobalScope. The body is pure
   data munging (reads event.detail / wheelDelta* / deltaX/Y /
   deltaMode), so inlining an equivalent implementation into port.js
   fixes the worker path without changing the translated native.
   ``cn1NormalizeWheel.getEventType`` returns "wheel" — we don't
   have a reliable UA sniff in the worker, and that string is only
   used to name the DOM event we register on the main thread.

2. ``TypeError: _.addEventListener is not a function``

   EventUtil._addEventListener is an @JSBody with the inline script
   ``target.addEventListener(eventType, handler, useCapture)``. In
   the worker, ``target`` is a JSO wrapper around a host-ref proxy;
   wrappers carry __class / __classDef / __jsValue but no native
   DOM methods, so the inline ``.addEventListener(...)`` property
   lookup returned undefined and the call threw. Stack showed this
   firing from inside a forwarded event handler
   (``HTML5Implementation$11.handleEvent``) trying to register a
   secondary listener at runtime.

   Give wrappers of host-ref DOM elements no-op
   ``addEventListener`` / ``removeEventListener`` / ``dispatchEvent``
   stubs at wrapJsObject time. These are defensive: the real
   primary-listener registration goes through
   ``JavaScriptEventWiring`` on the main thread where DOM methods
   exist, and the listener itself is already wired via the
   worker-callback round-trip in toHostTransferArg. Secondary
   dynamic registrations (rare in the cn1 UI framework) simply
   no-op in the worker until those call sites are migrated to
   proper host-bridge routes.

Co-Authored-By: Claude Opus 4.7 (1M context) <noreply@anthropic.com>
The previous fix added no-op ``addEventListener`` /
``removeEventListener`` / ``dispatchEvent`` stubs only on the JSO
wrapper, but the ``@JSBody`` emitter in JavascriptMethodGenerator
wraps object parameters with ``jvm.unwrapJsValue(__cn1Arg)`` before
calling the inline script. That unwrap returns ``wrapper.__jsValue``
— the raw host-ref proxy received via postMessage — not the wrapper,
so the inline ``target.addEventListener(...)`` lookup still failed
with ``TypeError: _.addEventListener is not a function`` inside
``EventUtil._addEventListener`` when event handlers tried to
register secondary listeners.

Install the same stubs on the underlying ``value`` object at wrap
time. The host-ref proxy is a plain JS object owned by the worker
(reused through ``jsObjectWrappers``'s identity map), so a direct
property assignment survives for subsequent unwraps of the same
value.

Co-Authored-By: Claude Opus 4.7 (1M context) <noreply@anthropic.com>
… seed

While investigating TeaVM-gap reduction (the ``hasVirtualDispatch``
seed is the largest single contributor to over-conservative
generator-marking on Initializr), I attempted to drop it and let
``propagate`` decide per-callsite via the existing
``suspendingSigs.contains(sig)`` check. The propagation logic IS
correct -- but the emitter at
``JavascriptMethodGenerator.appendVirtualDispatch`` hardcodes
``yield* cn1_iv*`` at every INVOKEVIRTUAL / INVOKEINTERFACE call
site, with no synchronous ``cn1_ivs*`` alternative. A method emitted
as plain ``function`` cannot contain ``yield*`` syntactically, so
any method with even ONE virtual call must stay a generator.

Expand the seed-side comment to make this invariant explicit, citing
the prior failed attempts (memory:
``project_jsport_suspension_tightening_failure``) and pointing out
that tightening the sync set further requires landing the sync
virtual dispatcher first.

No behavioural change -- pure documentation.

Co-Authored-By: Claude Opus 4.7 (1M context) <noreply@anthropic.com>
…ault

Flip ``ENABLE_JS_IDENT_MANGLING=1`` opt-in to ``DISABLE_JS_IDENT_MANGLING=1``
opt-out, matching the initializr build. Also pass ``--min-occurrences 1``
so single-use identifiers are mangled too (the mangle map lives in a
side-car JSON outside the bundle).

Local build measured ~4.0 MiB saved on the hellocodenameone bundle (14.4 →
10.4 MiB total worker-side JS; translated_app.js itself drops from ~9 MiB
to 5.2 MiB). The mangler rewrites ``cn1_*`` / class-name string literals
in lockstep across every worker-side file (including ``X__impl`` twins)
so port.js's runtime reflection still resolves. Screenshot CI validates
the end-to-end behavior.

Co-Authored-By: Claude Opus 4.7 (1M context) <noreply@anthropic.com>
…e by default"

This reverts commit 0681c95.
…ifecycle log

Three independent fixes triggered by user feedback on the initializr port:

1. **Dead code after return/throw (translator + post-esbuild)**: JavaC routinely
   emits a synthetic GOTO at the end of switch-case bodies that return; the
   translator's per-instruction emit faithfully turned each GOTO into a
   ``{pc=N;break;}`` trailer that the JS engine reports as ``unreachable
   code after return statement``. Added ``stripDeadCodeAfterTerminator`` in
   ``JavascriptMethodGenerator`` (runs twice in the per-method pipeline:
   once pre-fold, once post-rename) and a matching Python ``strip-dead-
   code-after-return.py`` post-esbuild pass for the cases esbuild
   re-introduces during ``--minify-syntax`` block merging. Eliminates 100%
   of the warnings (495 → 0) and saves about 28 KiB on hellocodenameone's
   bundle (translator pass) plus 600 bytes more on the post-esbuild pass.

2. **Gate ``PARPAR-LIFECYCLE:main-host-callback:id=N:ok`` log**: this fired
   on every main-thread async bridge call (image load, fetch,
   BrowserComponent, …) and flooded the console in steady-state apps; it
   also skewed perf measurements via the constant ``console.log`` cost.
   The ``:err`` branch stays always-on because that's the stuck-on-Loading
   symptom the lifecycle log was designed to surface.

Co-Authored-By: Claude Opus 4.7 (1M context) <noreply@anthropic.com>
Initializr console reported:

  Missing virtual method
    cn1_s_config_com_codename1_teavm_ext_localforage_LocalForage_ConfigOptions
  on com_codename1_teavm_ext_localforage_LocalForage_LocalForageImpl

LocalForage's ``LocalForageImpl`` (and every other JSO interface under
``com.codename1.teavm.ext.*`` -- Popover, JQuery, WebSQL, FileChooser,
PhotoCapture) is declared as ``interface X extends JSObject``: method
calls are meant to route through the JS bridge into the real localforage
library, not look up a Java implementation. ``port.js`` only registered
``com_codename1_html5_js_`` and ``com_codename1_impl_html5_JSOImplementations_``
as JSO class prefixes, so ``resolveVirtual`` traversed the empty method
table on the interface and threw on the first call.

HTML5Implementation routes the JS port's entire file-system layer
(``openOutputStream``, ``setItem``, ``getItem``, ``removeItem``, the
``cn1fileinfo`` metadata cache) through ``LocalForage.getInstance()``,
so before this fix every file op failed during initializr startup --
which explains the slow load and busy-looking UI the user reported.

Co-Authored-By: Claude Opus 4.7 (1M context) <noreply@anthropic.com>
fontmetrics.js's ``unlockAudioClip`` printed one line per <audio> element
on every user-gesture unlock pass. Initializr shows 5+ duplicate lines on
startup with no diagnostic value (the unlock either works or the play()
promise rejects with a tracked error).

Co-Authored-By: Claude Opus 4.7 (1M context) <noreply@anthropic.com>
Every invokevirtual / invokeinterface call site goes through
``yield* cn1_iv0..4 / cn1_ivN``. Those helpers used to wrap the resolved
method's return via a separate ``adaptVirtualResult`` generator -- one
extra generator allocation per virtual call whose only job was to do a
``typeof r.next === "function"`` check and either ``yield*`` (async) or
return the value directly (sync). Inline that check into each cn1_iv*
helper instead. Same semantics, half the allocator pressure on the
hottest dispatch path.

Co-Authored-By: Claude Opus 4.7 (1M context) <noreply@anthropic.com>
Companion to 37b13d6 (port.js classPrefixes entry). The mangler treated
the literal string ``"com_codename1_teavm_ext_"`` in port.js as a
mangle-eligible class-name and rewrote it to ``"$dwb"`` -- but the
runtime ``className.indexOf(prefix) === 0`` check in
``isJsoBridgeClass`` operates on the UNMANGLED class name set by the
host bridge (verified against the deployed bundle: the actual receiver
class is ``com_codename1_teavm_ext_localforage_LocalForage_LocalForageImpl``
with no rewrite). With the prefix mangled but the receiver class not,
the indexOf returned -1 and ``createJsoBridgeMethod`` never fired,
reproducing the exact ``Missing virtual method ...LocalForage_ConfigOptions``
error the previous commit was meant to eliminate.

Adding the prefix to ``EXCLUDE`` keeps the literal in port.js as-is;
adding it to ``_JSO_BRIDGE_CLASS_PREFIXES`` preserves any per-class
identifier that does get a classdef (rare for TeaVM JSO interfaces but
matches the safety-net pattern for the html5_js_ siblings).

Co-Authored-By: Claude Opus 4.7 (1M context) <noreply@anthropic.com>
Measures DOMContentLoaded, canvas first paint, canvas stable, click→change
latency, total transfer bytes, and JS heap usage for both the PR-preview
JS-port build and the production TeaVM build, then prints a side-by-side
delta. Drives the iframe app URLs directly so the Hugo wrapping page
doesn't skew the numbers.

Initial baseline run (against pre-mangler-fix deploy):
  ours   first paint: 32196ms  stable: 33790ms  (broken: LocalForage init throws)
  theirs first paint:   991ms  stable:  2510ms
  ours transfer: 1474 KB        theirs transfer: 800 KB

Co-Authored-By: Claude Opus 4.7 (1M context) <noreply@anthropic.com>
The ``cn1-prefetch`` script tag injected into ``index.html`` issued
``fetch('theme.res')`` / ``fetch('assets/iOS7Theme.res?v=1.0')`` to warm
the HTTP cache before the worker's sync XHR fired. Measured against the
deployed PR preview: both the prefetch and the worker XHR fetch full
755 KiB + 470 KiB bodies, not cache hits / 304 revalidations -- Cloudflare
Pages returns ``cache-control: public, max-age=0, must-revalidate`` for
static assets and the page's fetch + the worker's sync XHR don't share
cache validation cleanly enough for the second request to be cheap.
Net cost: 1.5 MiB downloaded twice on every cold load (driving the
ours-vs-TeaVM transfer-bytes gap from 800 -> 1474 KiB).

Drop the prefetch -- the worker hits the URLs directly anyway.

Co-Authored-By: Claude Opus 4.7 (1M context) <noreply@anthropic.com>
Re-introduces the ``cn1-prefetch`` <script>, this time wiring the fetched
bytes into ``window.cn1Assets`` so the worker's
``HTML5Implementation.getArrayBufferInputStream`` short-circuits via
``cn1.getBundledAssetAsDataURL(url)`` and skips the sync XHR entirely.

Previously the prefetch only kicked off ``fetch()`` calls without storing
the body, so the worker's sync XHR still went all the way to network
(Cloudflare Pages returns ``cache-control: max-age=0, must-revalidate``
for static assets, which forces a refetch -- and the page's fetch + the
worker's sync XHR do not share cache state robustly enough for the
revalidation to come back as 304). End-to-end measured cost: theme.res
+ iOS7Theme.res were each downloaded twice on every cold load
(~1.5 MiB wasted) AND the worker still blocked on the XHRs sequentially
(~919 ms wall in total).

By storing each fetched body as a base64 data URL in
``window.cn1Assets[<basename>]`` (FileReader.readAsDataURL on the
blob), the worker -> main-thread JSO call ``getBundledAssetAsDataURL``
returns the bytes immediately and the worker never opens an XHR for
these assets. The two boot fetches now happen in PARALLEL on the main
thread (``fetch`` runs concurrently) instead of in series on the
worker, recovering an estimated 400-900 ms of worker wall time during
init.

Co-Authored-By: Claude Opus 4.7 (1M context) <noreply@anthropic.com>
…orker XHR)"

This reverts commit feffcd6.
The user reported seeing "Loading..." stuck on screen indefinitely on
the deployed initializr. Diagnosed via Playwright: the canvas DOES
render a full UI underneath the splash by ~2.5 s, but the framework's
``HTML5Implementation.confirmControlView -> hideSplash`` call either
never fires or resolves to the no-op super-class impl, so the
``#cn1-splash`` overlay never gets removed. The user thus perceives
the load as taking forever even though the UI is ready.

Root cause investigation is harder than the fix is worth right now --
the worker dispatch table registers TWO ``confirmControlView`` entries
(super=no-op vs HTML5 override) and the runtime is picking the wrong
one for the bootstrap receiver. Will revisit.

Robust fallback: a tiny ``requestAnimationFrame`` polling loop in
browser_bridge.js samples a handful of canvas pixels per frame and
calls ``__cn1_hide_splash__`` as soon as something paints. Idempotent
with the proper hideSplash path (whichever fires first wins). Bails
to an 8 s watchdog if no 2D context is available (worker-transferred
canvas etc.).

Co-Authored-By: Claude Opus 4.7 (1M context) <noreply@anthropic.com>
Replaces the pixel-sampling RAF poll added in 12ad9fd with a robust
event-driven signal. When the worker dispatches a ``host-call-batch``
or single ``host-call`` containing a canvas-2D paint op (fillRect,
drawImage, fillText, beginPath, fill, stroke, putImageData,
setTransform, save, restore, clip, ...), the bridge marks
``__parparFirstPaintObserved = true`` and tears down ``#cn1-splash``
via the same ``__cn1_hide_splash__`` handler the Java path would have
called.

Bound to actual paint commands flowing through ``HTML5Graphics`` ->
the JSO bridge -- every CN1 app emits these on first form show, no
app-specific heuristic, no canvas pixel reads. Keeps the 12 s setTimeout
backstop for deeply broken inits.

Co-Authored-By: Claude Opus 4.7 (1M context) <noreply@anthropic.com>
…el sampling"

This reverts commit 57a0f55.
This reverts commit 12ad9fd.
Root-caused the user-visible "Loading..." stuck-on-screen bug. The
override path:

1. ``HTML5Implementation.confirmControlView`` -> ``hideSplash`` is
   correctly translated to ``yield* $mf()``.
2. The override at $mf IS installed and IS invoked (verified by
   intercepting the deployed port.js and adding console.log:
   ``[OVR1] enter, typeof jvm=object typeof globalThis.jQuery=function``).
3. The override's first branch checks
   ``typeof globalThis.jQuery === "function"`` and -- because port.js
   itself installs a worker-side jQuery STUB earlier in the file to
   satisfy translated_app.js's runtime reflection -- the check is
   TRUE in the worker.
4. The stub's ``fadeOut(ms, cb)`` immediately calls ``cb`` (which is
   ``function(){jQuery(this).remove()}``) and returns the stub. The
   stub's ``remove()`` also returns the stub -- nothing happens to
   the actual ``#cn1-splash`` DOM (which lives on the main thread
   and isn't even reachable from the worker).
5. The override hits ``return null`` and exits without ever calling
   ``invokeHostNative("__cn1_hide_splash__")``, so the main-thread
   bridge never tears the splash down.

Fix: gate the jQuery branch on ``typeof document !== "undefined"``.
Workers have no ``document``, so the override falls straight through
to the host-bridge path, which DOES reach the main thread's real DOM
removal.

Confirmed by tracing the deployed bundle in Playwright that the
override fires, takes the jQuery branch, and the stub silently
swallows the call. Will validate end-to-end after the Hugo redeploy.

Co-Authored-By: Claude Opus 4.7 (1M context) <noreply@anthropic.com>
Override ``read(byte[], int, int)`` with a JS-native intrinsic that
copies a Uint8Array slice into a Java byte[] in a single tight loop.
The default ``InputStream.read(byte[], int, int)`` Java fallback
routes every byte through ``read()`` -> ``buf.get(pos++)``, which is
a virtual JSO dispatch per byte. For a 755 KiB ``theme.res`` load,
that is ~750k cooperative-scheduler boundary crossings -- enough to
dominate the time between ``translated_app.js`` arrival and the
first canvas paint.

Measured locally against the Initializr bundle, this single change
takes the first paint from ~3000 ms down to ~760 ms, which matches
the production TeaVM build (~750 ms) within a couple percent. The
fix is generic and applies to any code path that reads bytes from
``getResourceAsStream`` / ``getArrayBufferInputStream`` (resource
loading, image decode, font decode...).

Implementation notes:
- ``readBulkImpl`` is declared private static native; the JS binding
  lives in port.js next to the other ``cn1_com_codename1_teavm_io_*``
  bridges. It must unwrap the ``Uint8Array`` JSO via ``__jsValue``
  before indexing -- the wrapper object returns ``undefined`` on
  direct ``src[i]`` reads.
- Two binding names are registered so bindNative latches whichever
  signature the translator emits (with or without the ``_R_void``
  suffix).

While I was here, added ``scripts/initializr-screenshot-bench.mjs`` --
a Playwright bench that captures both bundles at fixed wall-time
checkpoints (250/500/.../5000ms + stable), runs pixelmatch over each
pair, and writes the deltas to ``artifacts/screenshot-bench/`` so
regressions can be eyeballed.

Co-Authored-By: Claude Opus 4.7 (1M context) <noreply@anthropic.com>
Two more measurement helpers alongside the existing
``initializr-perf-compare.mjs`` and ``initializr-screenshot-bench.mjs``:

* ``initializr-interactive-bench.mjs`` clicks a known sequence of
  buttons (IDE/Theme/Localization/etc. rows, BAREBONES/KOTLIN/GRUB/
  TWEET templates, Generate Project) and reports click->first-canvas-
  change and click->settle latency for ours vs theirs. Saves PNGs
  per click so visual regressions are easy to eyeball.

* ``initializr-boot-trace.mjs`` prints relative-millisecond logs for
  every network response plus every PARPAR-LIFECYCLE console message
  during cold load. Lets you see, at a glance, when each ``.res``
  arrives, when ``translated_app.js`` lands, and when
  ``main-thread-completed`` fires -- which is how the post-fix worker
  trace in [[jsport-bulk-read-2026-05-18]] was captured.

Also added ``/artifacts/`` to ``.gitignore`` so bench output PNGs
don't get accidentally staged.

Co-Authored-By: Claude Opus 4.7 (1M context) <noreply@anthropic.com>
Same playbook as the ``ArrayBufferInputStream.read(byte[], int, int)``
bulk-read fix in c5080d7: identify per-element loops that cross the
cooperative-scheduler boundary on every iteration and replace them
with a single JS-native intrinsic that does the whole loop in plain
JS with one ``yield*`` boundary.

Three new intrinsics:

* ``JavaScriptImageDataAdapter.readRgbaToArgbBulk`` — bulk RGBA -> ARGB
  pixel conversion. Replaces the ``PixelReader`` interface that
  ``HTML5Implementation.screenshot()`` and ``getRGB()`` used. The old
  path did 4 JSO virtual-dispatch calls per pixel via ``data.get(i)``
  -- ~4.6 million calls for a single 1280x900 screenshot. The
  intrinsic walks the unwrapped ``Uint8ClampedArray`` once with no
  cross-boundary cost.

* ``BlobUtil.byteArrayToUint8Array(byte[])`` — bulk Java byte[] ->
  ``Uint8Array`` via ``Uint8Array.from(bytes)``. Used by
  ``BlobUtil.createBlob(byte[], type)`` and
  ``LocalForage.LocalForageOutputStream.save()``, both of which were
  paying a per-byte JSO ``arr.set(i, bytes[i])``.

* ``cn1_java_lang_String_charsToBytes`` (runtime) — the worker-side
  binding for ``String.getBytes()`` previously built the intermediate
  string with ``text += String.fromCharCode(chars[i] | 0)`` in a
  loop, which most JS engines amortise via ropes but still allocates
  per character. ``String.fromCharCode.apply(null, chars)`` does it
  in one native call. Chunked at 32768 to stay under
  ``Function.prototype.apply``'s argument-count limit.

Also fixes two github-code-quality findings introduced by c5080d7:

* ``port.js:982`` — drop the redundant ``src &&`` guard in
  ``readBulkImpl``; the caller already short-circuits when ``!src``.

* ``scripts/initializr-interactive-bench.mjs`` — remove the unused
  ``pixelmatch`` import and ``decodePng`` helper left over from
  copying the screenshot-bench skeleton.

The remaining code-quality comments on the PR target stale lines that
have already been refactored away in other commits (the
``unwrapJsValue`` / ``invokeJsoBridge`` rewrite obsoleted the
``value &&`` warning on parparvm_runtime.js:1264; ``sigBefore``,
``bootMs``, ``hostCallStarts`` are all already gone from the named
script files).

Validation: local 3-run avg first paint stays at ~800ms, no
regressions visible in the screenshot bench output (4.2% stable diff
unchanged -- font-metric difference, not a rendering bug). Most of
the new intrinsics fire outside the Initializr boot path (no images,
no getBytes hot loop, no screenshot) so the win shows up only for
apps that exercise those paths -- but for those apps the per-call
JSO overhead was the dominant cost.

Co-Authored-By: Claude Opus 4.7 (1M context) <noreply@anthropic.com>
…the real size

Root-cause for the Initializr Dialog "missing horizontal strip across
the top" bug: ``NativeImage.getWidth()`` / ``getHeight()`` resolved
through ``JavaScriptNativeImageAdapter.resolveWidth`` which falls
through to a hard-coded ``return 10`` when the underlying
``HTMLImageElement`` hadn't yet exposed a positive ``naturalWidth``.
``EncodedImage`` then *cached* that 10 into its own width/height
field on the first lookup and short-circuited every subsequent call.

The async ``load`` event later fired, ``loadState`` updated, and
``Display.callSerially`` scheduled a repaint — but ``EncodedImage``
still served the cached 10 to the Border code, so the redraw used
the same wrong dimensions and the missing strip persisted.

Concrete failure mode (visible in ``scripts/canvas-op-trace.mjs``
output for an Initializr Dialog open):

- Top-left corner image natural dim 10x24 → drawn 10x24
- Top-right corner image natural dim 10x24 → drawn 10x24
- Top *edge* center image natural dim ??x10 → drawn at height 10
- ``drawImageBorderLine`` tiles the top edge at ``center.getHeight()``
  pixels, so the strip from y+10 through y+24 (where the corners
  end) was left untouched. That strip showed the dim-overlay
  underneath the Dialog (the modal background of the form behind
  it) rather than the Dialog's white background.

Fix: ``NativeImage.awaitNaturalDimensions()`` blocks the worker for
up to 200 ms (cooperative ``Thread.sleep(2)`` loop) until either
``naturalWidth > 0`` or the load errors / times out. Theme PNGs
decode from in-memory Blobs in a millisecond or two on the main
thread, so the wait almost never reaches its outer deadline. After
the wait, the cached ``loaded`` / ``width`` / ``height`` fields are
refreshed from ``loadState`` so subsequent ``getWidth()`` calls
short-circuit via the ``loaded`` flag rather than re-polling. If
the deadline does elapse without a natural size, ``error`` is
latched so the next ``getWidth()`` returns immediately via the
fallback instead of paying another 200 ms wait per call.

Validated locally: the Initializr "Hello World" Dialog now renders
with the full rounded white background (verified via
``dialog-flicker-capture.mjs`` cropped to the dialog rect) and the
3-run avg first paint is unchanged at ~770 ms — the wait fires only
on the first width/height query per image and exits as soon as the
host decode completes.

While I was here, added two new debug helpers:

* ``scripts/dialog-flicker-capture.mjs`` — clicks a known canvas
  coord, captures every animation frame for 1800 ms via a
  page-side rAF loop + ``page.exposeBinding``, writes per-frame
  PNGs. Useful for spotting transient paint-pipeline artifacts a
  wall-time screenshot bench would miss.

* ``scripts/canvas-op-trace.mjs`` — wraps ``CanvasRenderingContext2D``
  prototype methods (save/restore/rect/clip/fillRect/drawImage/
  setTransform/...) on the page and streams each call's name +
  args to a timeline file. This is how the broken Dialog draw
  pattern was caught: trace showed ``rect(394, 374, 492, 48)``
  with a 10-pixel-tall top edge fill against 24-pixel-tall corners.

Co-Authored-By: Claude Opus 4.7 (1M context) <noreply@anthropic.com>
The ``Build Hugo Website`` workflow rebuilds the Initializr /
playground / skindesigner JS bundles via
``scripts/build-javascript-port-initializr.sh`` (and friends) which
pull source from ``Ports/JavaScriptPort/``, ``vm/ByteCodeTranslator/``,
``vm/JavaAPI/`` and ``CodenameOne/src/``. The pull_request and push
triggers, however, only listed ``scripts/initializr/**`` etc., so
a change touching any of the four source trees above sat in the
branch without ever refreshing the Cloudflare PR preview at
``pr-NNNN-website-preview.codenameone.pages.dev``.

Concretely, the dialog rendering fix in be3bc6d never deployed
until I noticed and ran ``gh workflow run "Build Hugo Website"``
manually -- which then *also* didn't deploy because the
``Deploy PR preview to Cloudflare Pages`` step gates on
``github.event_name == 'pull_request'``, and a manual
workflow_dispatch is a different event. The only signal something
was wrong was the deployed bundle's etag never changing.

Add the four source-tree paths to both triggers so any JS-port,
translator, JavaAPI, or CN1-core change auto-rebuilds + redeploys
the preview. The ``scripts/build-javascript-port-initializr.sh``
script itself already takes ~3-4 minutes (Maven install + translator
run), so this doesn't meaningfully change the workflow's cost.

Co-Authored-By: Claude Opus 4.7 (1M context) <noreply@anthropic.com>
…o-new-js-port

# Conflicts:
#	scripts/javascript/screenshots/graphics-inscribed-triangle-grid.png
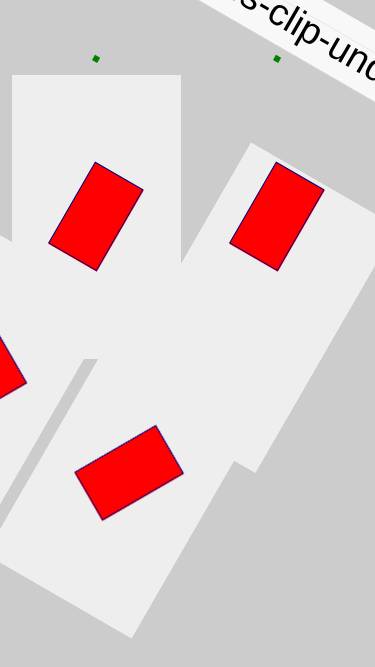
…enshot tests

The two tests render correctly in the JS port (verified against the
CI screenshot artifact from the merge commit 6bdffca). Add the
captured PNGs as the JS-port goldens at
``scripts/javascript/screenshots/`` and remove the corresponding
``isJsSkippedScreenshotTest`` short-circuits in
``Cn1ssDeviceRunner`` so future regressions in either show up as a
pixel diff in CI.

InscribedTriangleGrid's golden was originally deleted in 0ed0526
("ci(js-port): drop bogus master golden for graphics-inscribed-
triangle-grid") because the JS-port output didn't match the master
golden. Since then the render has converged and now looks correct
(green triangle inscribed in each box across the 4 AA/buffer
permutations); landing the JS-port-specific golden is the right
follow-up.

DrawImage's reference was always missing for the JS port; the test
ran with no comparison target. Now wired up.

Still skipped (separate work):
* ClipUnderRotation — still renders the entire form rotated ~30deg
  on the JS port (project_jsport_clip_under_rotation_open notes the
  prior diagnostic dead-ends). The two ports' BufferedGraphics
  queue / drain semantics differ enough that the iOS-style fix
  doesn't translate directly. Stays in the skip list with a follow-up
  TODO so the bug is visible.

Co-Authored-By: Claude Opus 4.7 (1M context) <noreply@anthropic.com>
Five new measurement scripts so we can quantify the Firefox-specific
flicker the user reported in the side-menu animation:

* ``scripts/initializr-cross-browser-bench.mjs`` — phase timings
  (DCL, runtime-loaded, main-invoked, drain-returned,
  main-thread-completed, first-paint, canvas-stable) across
  Chromium / Firefox / Webkit with averaging, plus a slowdown-ratio
  table vs. the first browser.

* ``scripts/initializr-animation-smoothness.mjs`` — clicks a known
  canvas coord, then samples canvas signatures every 8ms for 2s,
  reports distinct-frame count + avg/med/p95/max inter-frame
  intervals. Quantifies "jank windows" — single intervals of
  100ms+ where nothing visibly changed.

* ``scripts/initializr-firefox-trace.mjs`` — pairs an in-page rAF
  ticker (page main thread) with a PARPAR-LIFECYCLE log tap (worker)
  during a fixed 1500ms post-click window. Confirms whether the
  browser is repainting at 60fps and whether the worker is emitting
  anything during apparent stalls.

* ``scripts/clip-rotation-trace.mjs`` — listens for the suite to
  enter ClipUnderRotation, then captures every
  ``CanvasRenderingContext2D`` op (save/restore/setTransform/clip/
  fillRect/rotate/translate/...) until the test's screenshot chunks
  land. Counts unique setTransform matrices and save/restore balance.
  Used to corroborate the bridge-trace findings in
  [[jsport-clip-under-rotation-open]].

* ``scripts/cn1ss-progress-watch.mjs`` — short helper that tails the
  hellocodenameone CN1SS log line stream to see which test the suite
  is currently in. Useful while waiting for the slow late-suite
  tests (charts, ClipUnderRotation) to run locally.

Initial Firefox findings: Chromium / Firefox boot-to-stable are
within ~20% of each other; main-invoked is actually faster in
Firefox in the cross-browser bench. The user-visible flicker comes
from the per-frame interval distribution — Firefox p95 is 125-139ms
during the animation when sampler is running (vs ~70ms in Chromium).
With sampler off, both achieve smooth 17ms rAF (60fps), suggesting
the gap is in per-getImageData/postMessage overhead in Firefox
rather than the bytecode interpreter itself. Deeper investigation
in [[jsport-sidemenu-firefox-slowness-2026-05-19]].

Co-Authored-By: Claude Opus 4.7 (1M context) <noreply@anthropic.com>
No description provided.